Aperta: User-First End-to-End Product Design
We’re exploring solutions that can support individuals living with diabetes in maintaining their specific dietary needs, managing healthcare appointments, tracking daily insulin intake, and conveniently documenting all of this information in an easy-to-understand visual format.
Around 1.8 to 2 million Americans have Type 1 Diabetes (T1D), including about 304,000 children and teens, with roughly 64,000 new cases diagnosed annually.
Why it Matters:
T1D is a lifelong autoimmune condition where the body stops producing insulin, requiring constant management.
While T2D (Type 2 Diabetes) is far more common, T1D's increasing incidence in children highlights the need for awareness and research.
ROLE AND TEAM
Designer on
end to end product design
TOOLS
Figma
WHEN
September to December 2025
CONTEXT
We were tasked with designing an end to end product with a specific user at the for front of the design. I chose Type 1 diabetics as my user.
PROBLEM
Diabetics have an incredibly hard time maintaining their specific dietary needs, tracking daily insulin intake, documenting all of this information in an easy-to-understand visual format and keeping communication between caregivers seamless.
HOW I DID IT
Using
RESEARCH GOALS
Gain insight into how tracking blood glucose levels, diet, and medications integrates into the daily lives of individuals with diabetes.
Understand the methods and routines users follow to track this health information.
Identify any triggering events or patterns that prompt users to monitor or adjust their tracking behavior.
Competitive Analysis was used to identify competitors strengths and weaknesses, understand market positioning, Improve the product, discover gaps in the market, and anticipate trends and threats.
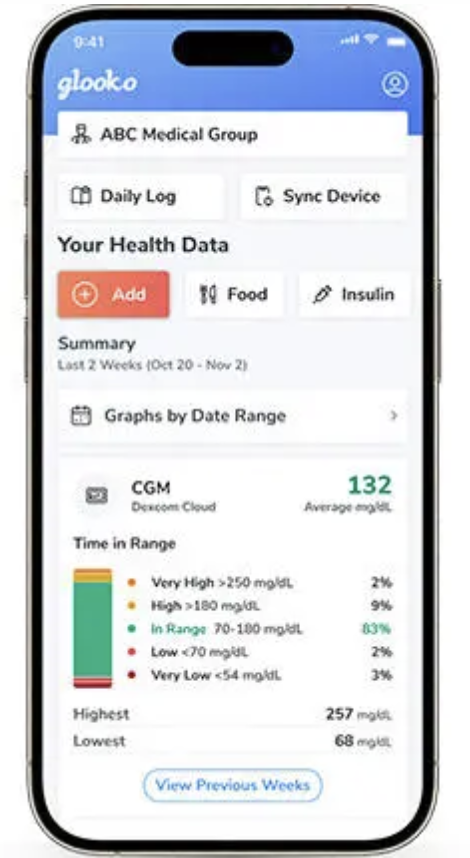
Glooko/ “Glooko's mission is to simplify care, strengthen connections, and create a brighter future for people living with diabetes and their healthcare teams by leveraging technology to transform how they manage the condition”
Intuitive data visualization: The app and web platform display synchronized data through clear, easy-to-read charts and graphs, allowing users and their care teams to quickly identify glucose trends. The web platform is particularly praised for its reporting features.
Website Link: glooko.com
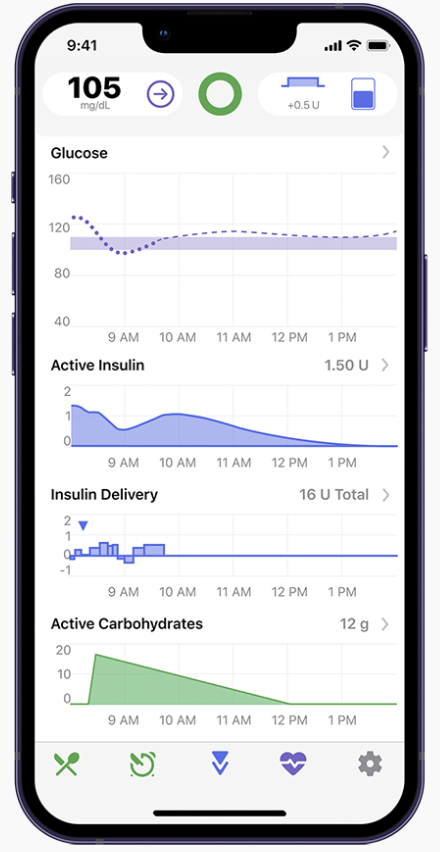
Tidepool/ “Tidepool's mission is to make diabetes data more accessible, actionable, and meaningful, reducing the burden of managing diabetes by providing free software that empowers people with diabetes, researchers, and clinicians through interoperable platforms”
Remote data sharing: The app allows users to securely share data with caregivers, family members, and their healthcare team. This is particularly useful for telemedicine visits and for parents of children with diabetes.
Website Link: tidepool.org
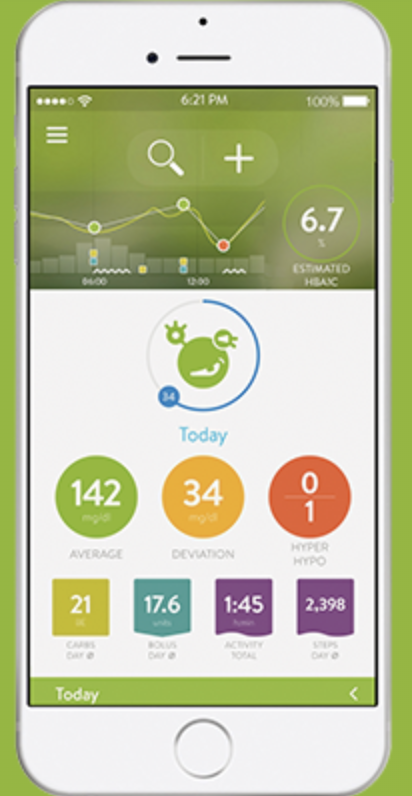
mySugr/ “The mission of mySugr is to simplify life with diabetes by providing tools, knowledge, and support to help people manage their daily diabetes routine with confidence, with the ultimate goal of making diabetes "suck less" and empowering users to take control of their health. ”
Customizable Logging: Users can track blood glucose, carbs, and insulin use, and the PRO version offers features like customizable reminders and personalized tags for detailed logbooks.
Website Link: mysugr.com
Contextual interviews
were conducted to observe how users currently track their health data in real-world settings.
Affinity Mapping
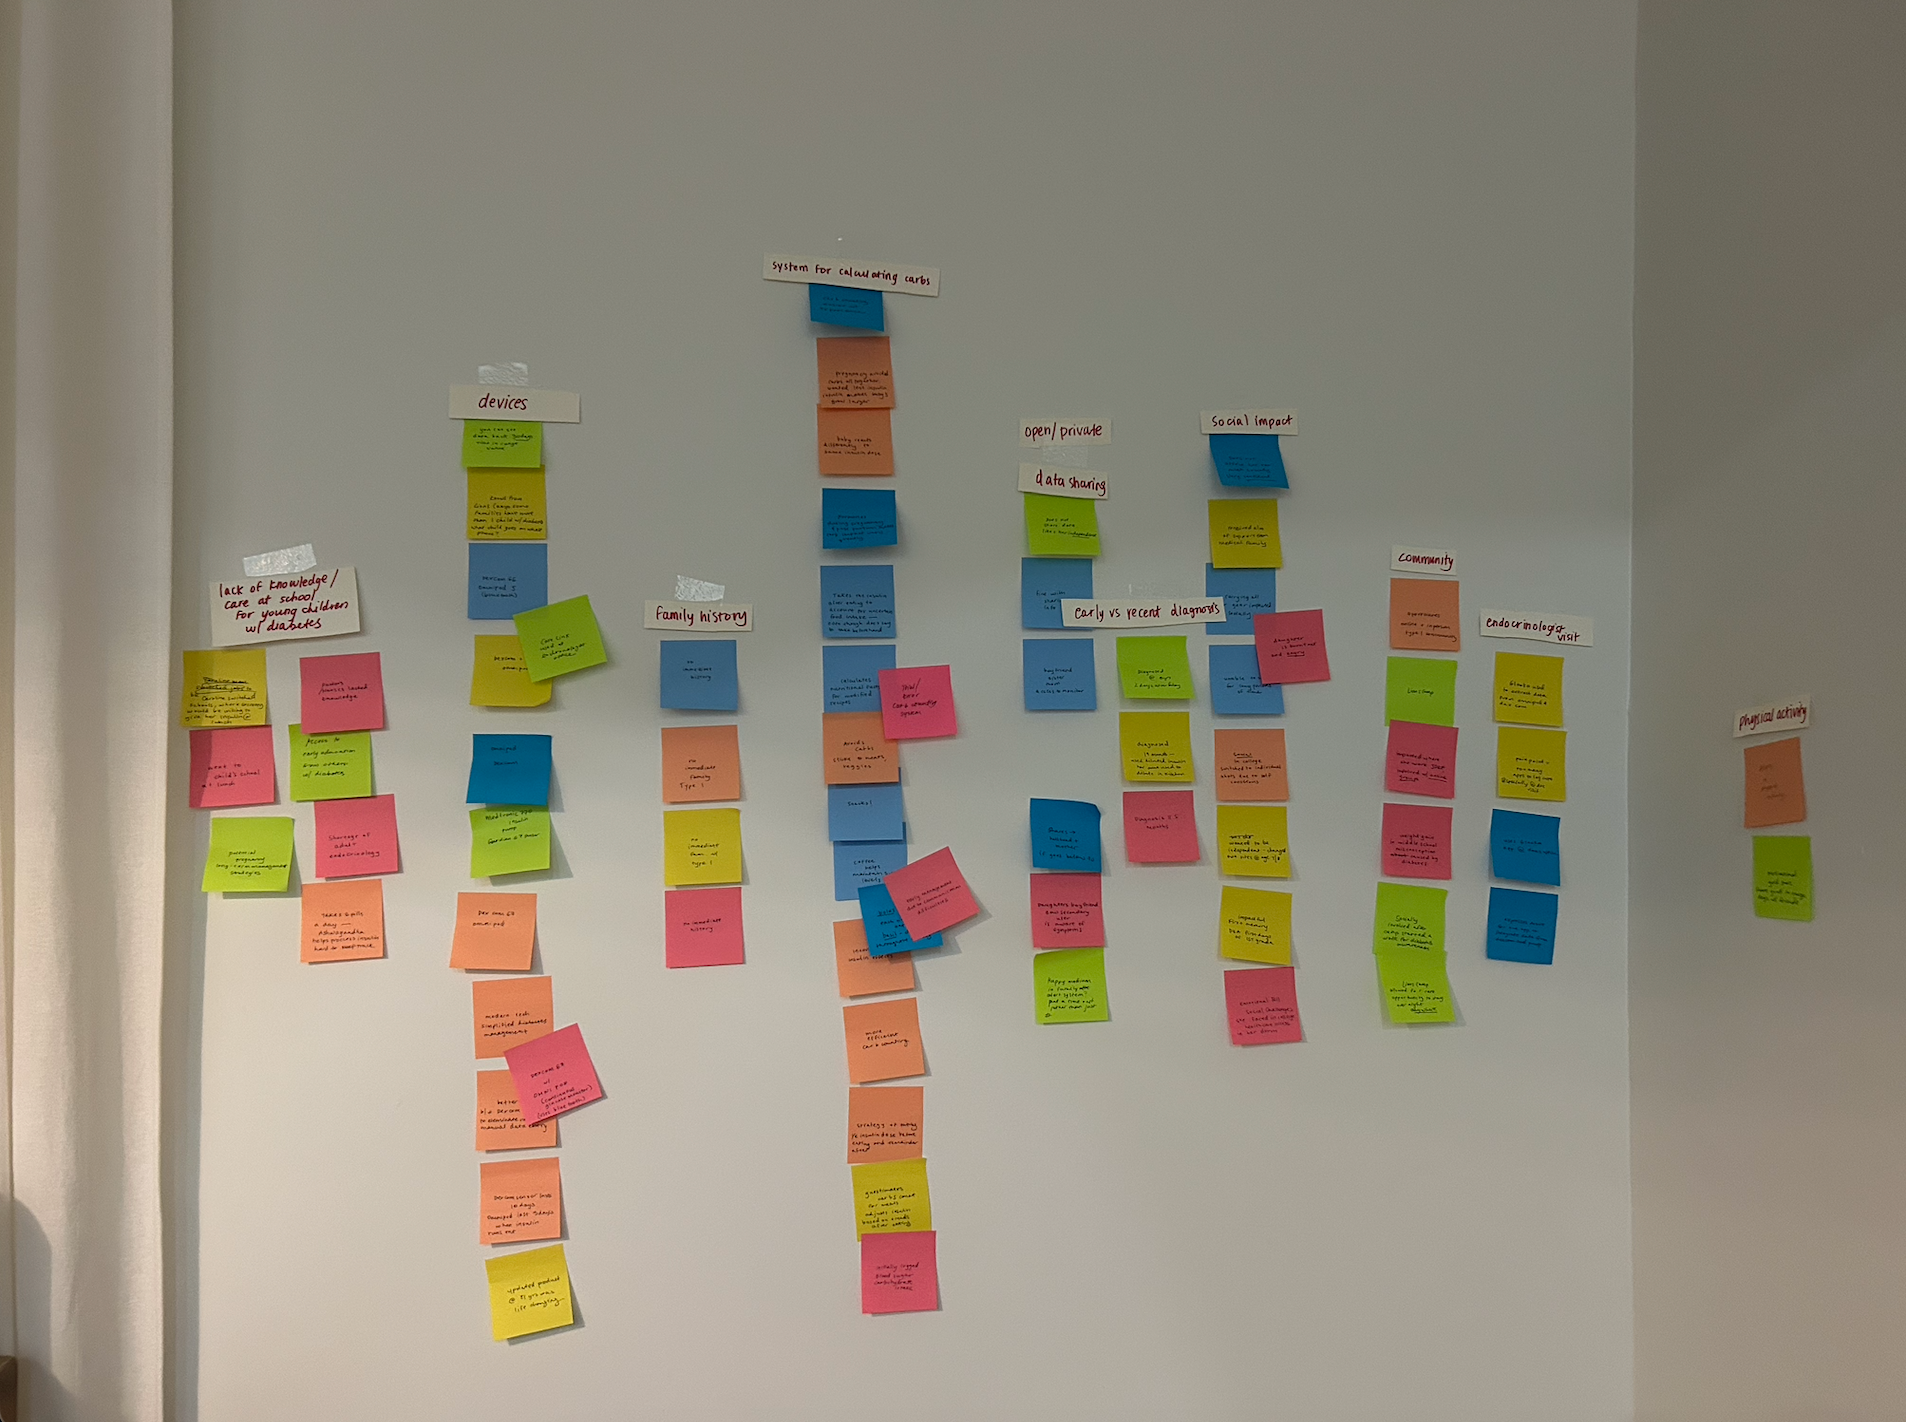
Organize research data (notes, quotes, observations) into clear themes
Identify patterns, needs, and pain points across users
Turn scattered insights into meaningful groups that inform design decisions
Build shared understanding and alignment within a team
Guide priorities for features, concepts, and next steps
Key Themes and Emerging User Needs
A need for clear, structured communication with support networks and caregivers.
An initial need for comprehensive, easy-to-understand guidance on using glucose monitoring devices, as well as efficient and accurate carbohydrate counting.
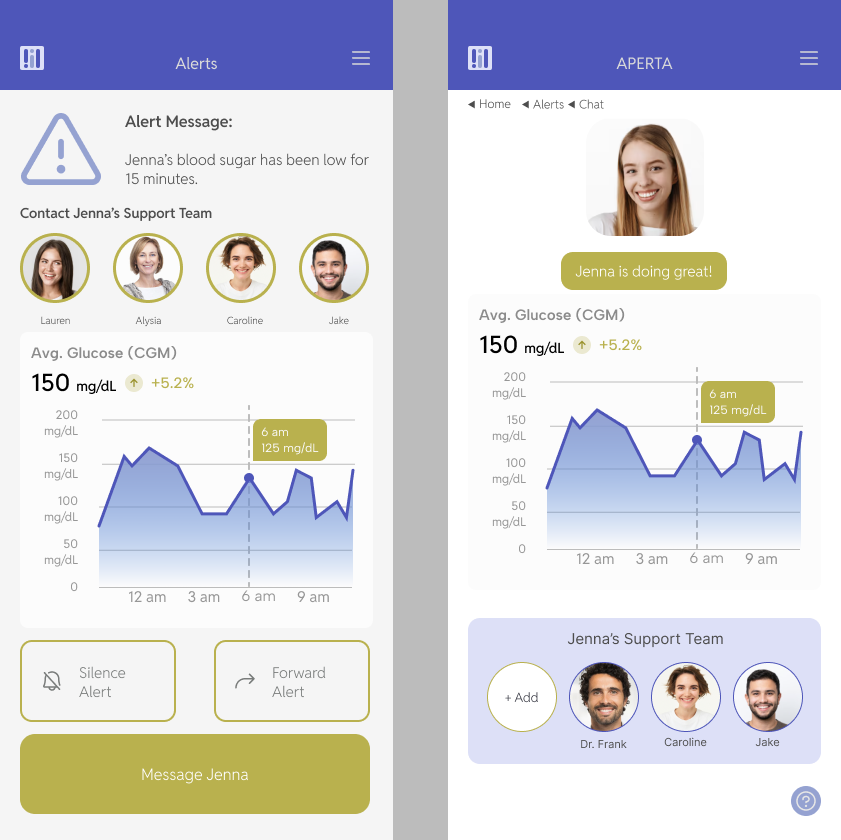
A need for a flexible alert system featuring time-based thresholds and customizable recipient lists, enabling users to share health data confidently without causing unnecessary alarm.
A need for long-term hormonal tracking to better understand how fluctuations impact insulin absorption and how the body responds to different foods over time.
Problem Uncovered & Defined
Help recently diagnosed diabetics more accurately estimate and log carb intake, reducing stress when determining insulin doses.
Support diabetics in sharing insulin levels with caregivers in a clear, non-judgmental, and contextual way that builds trust and reduces anxiety.
Provide parents of diabetic children with real-time updates and alerts from school caregivers to ensure their child is safely monitored throughout the day.
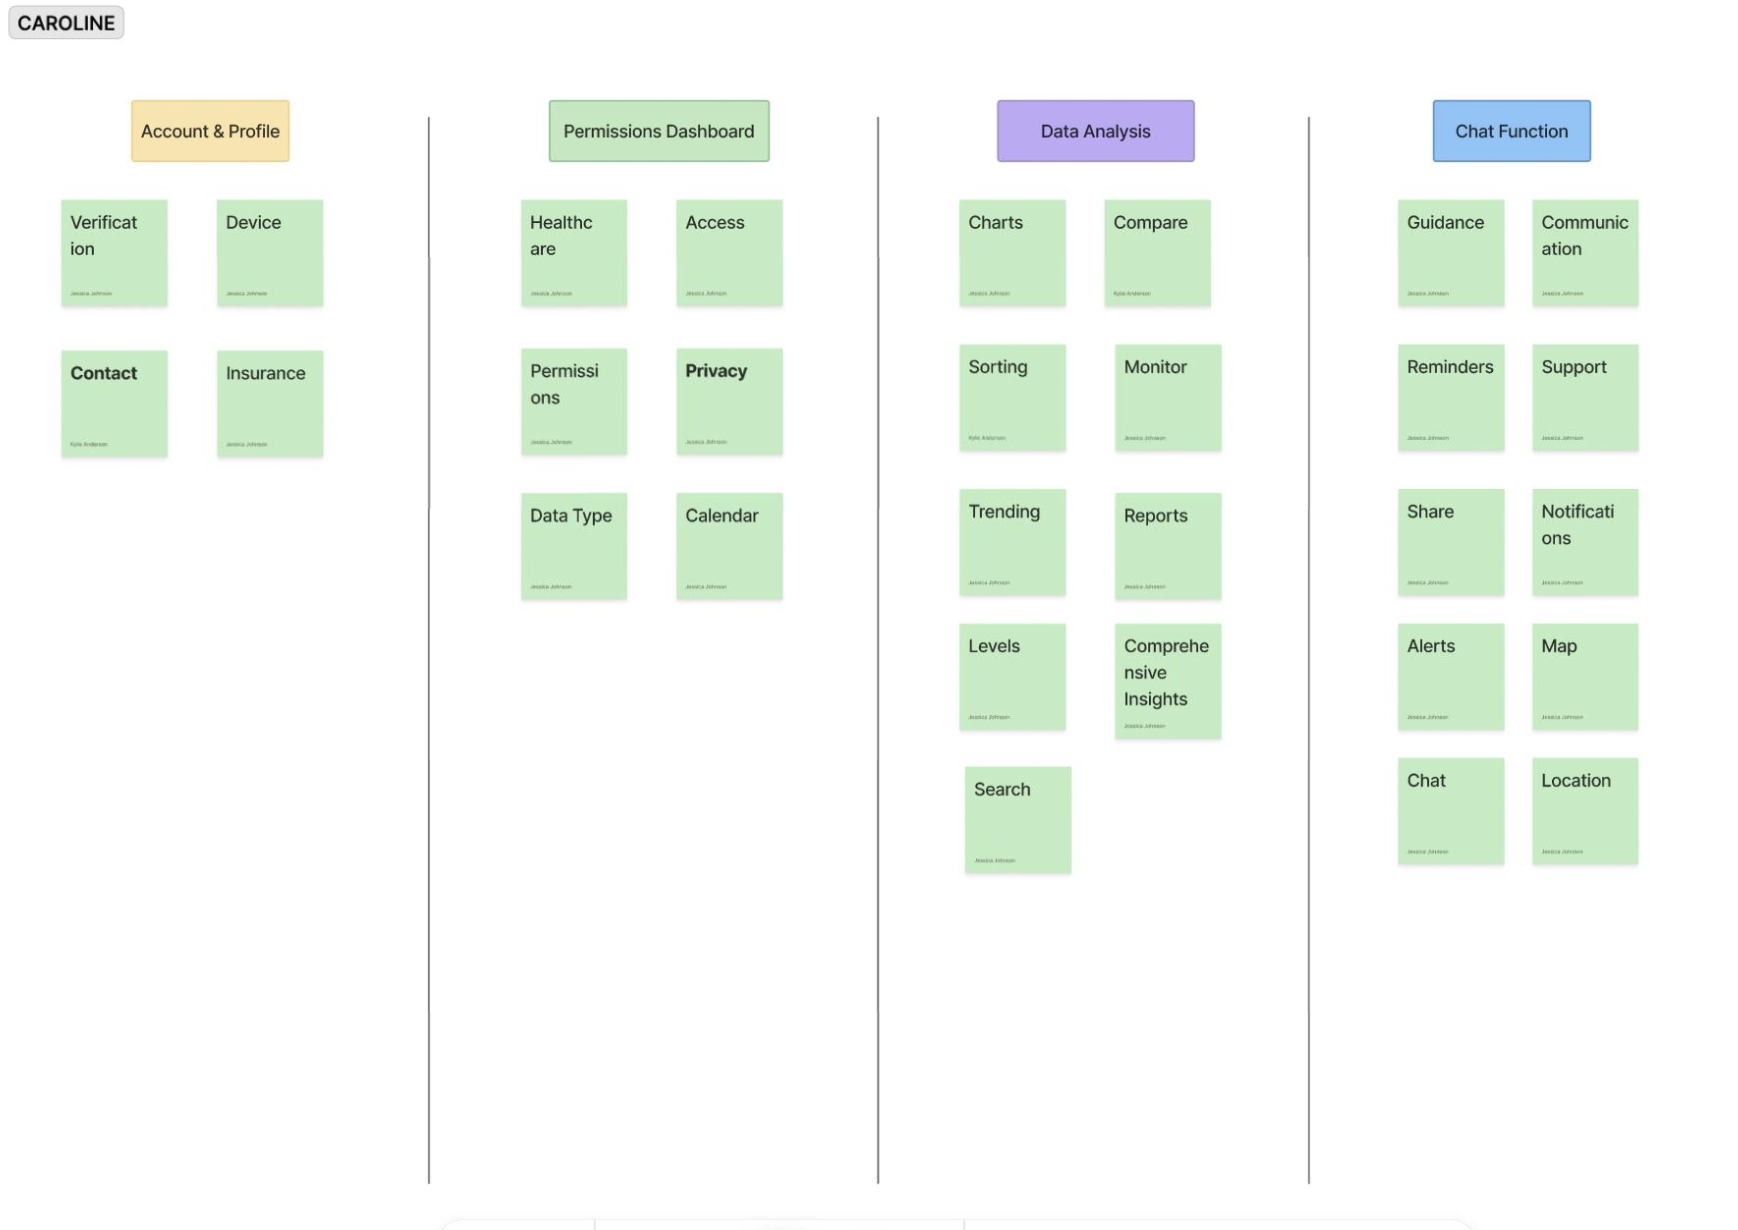
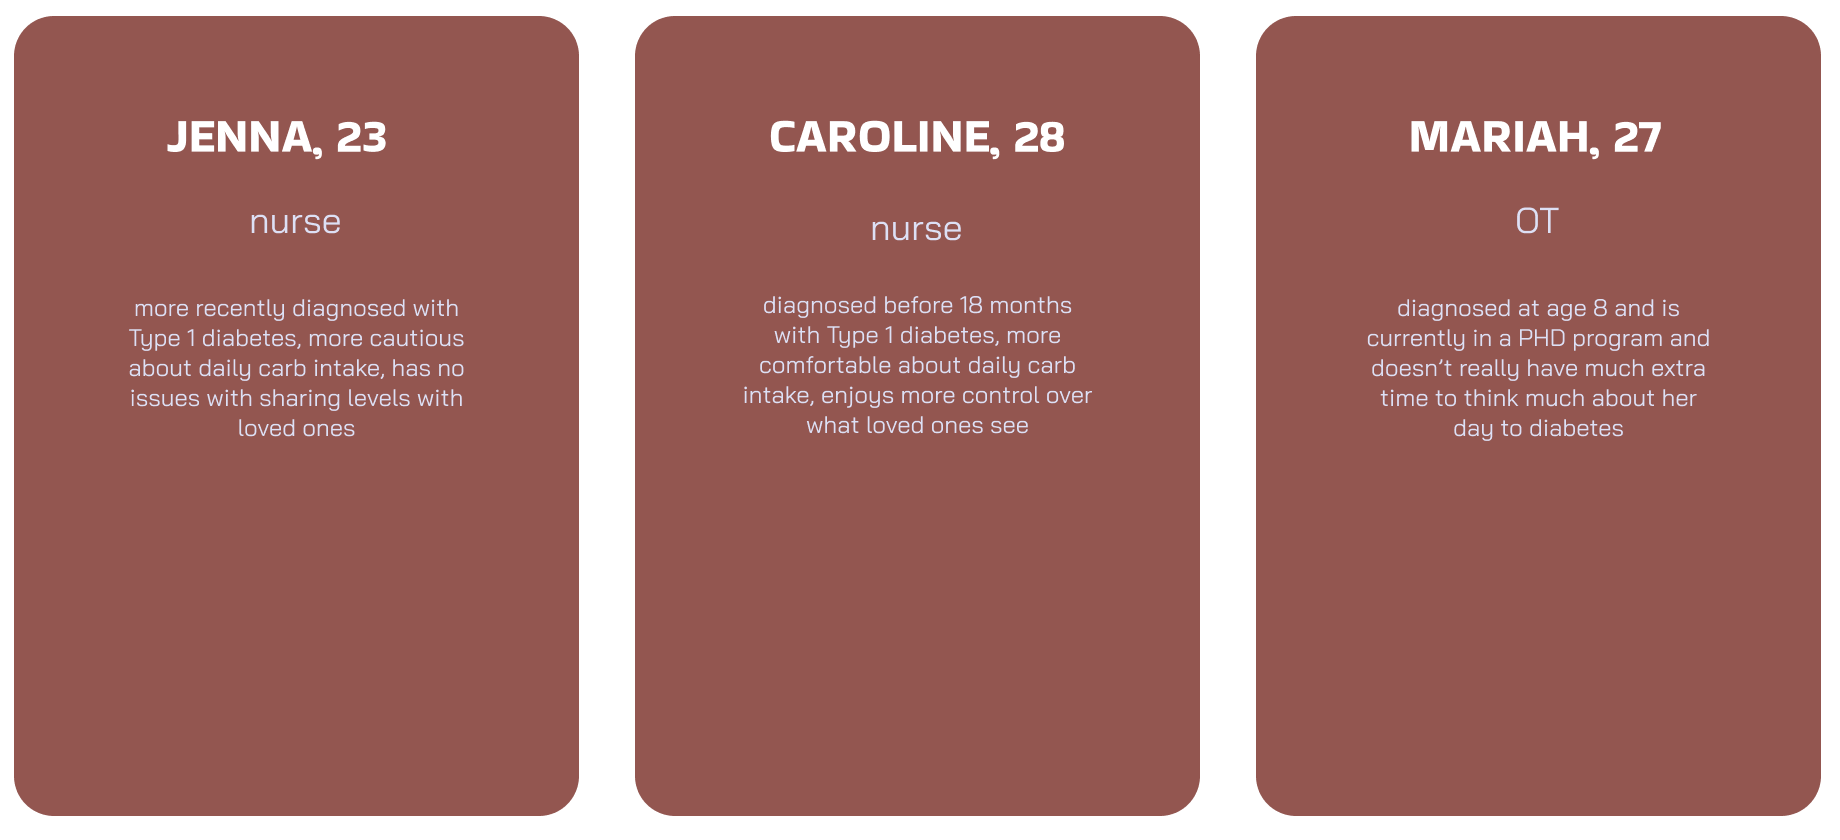
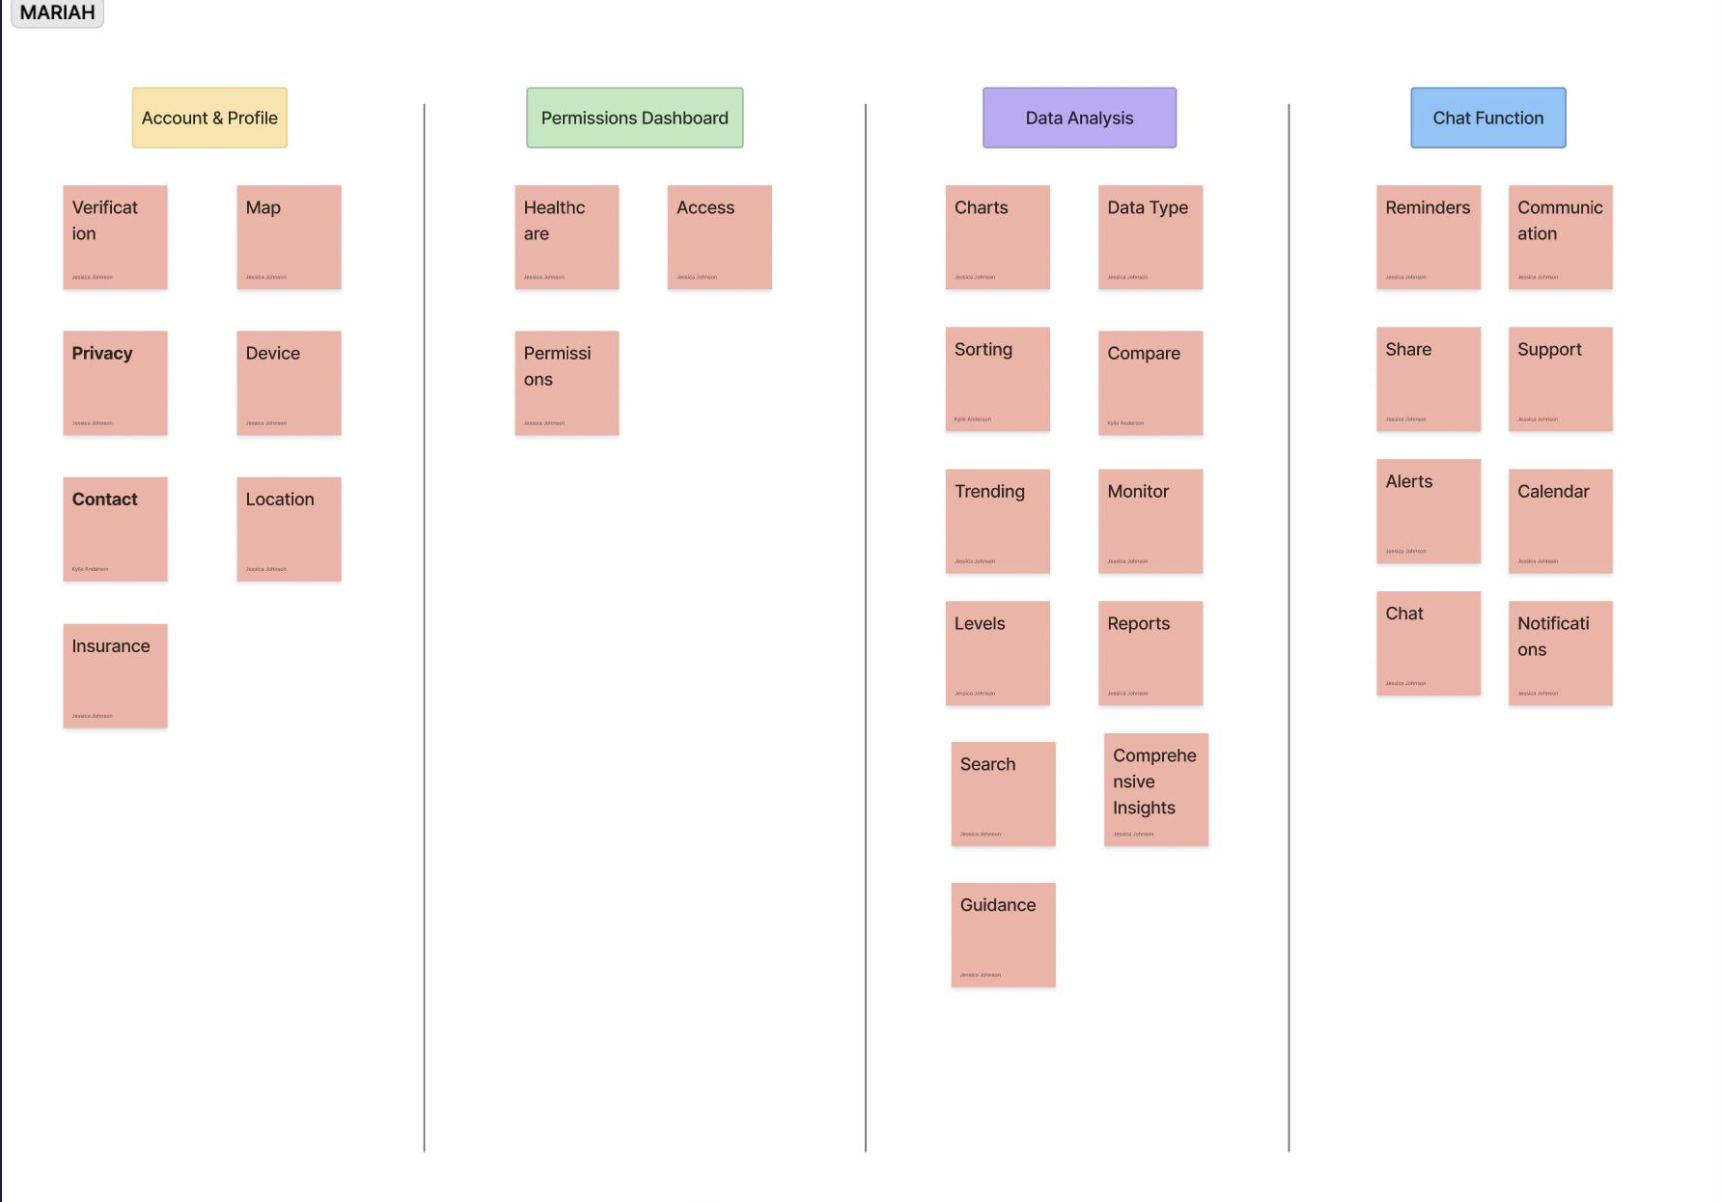
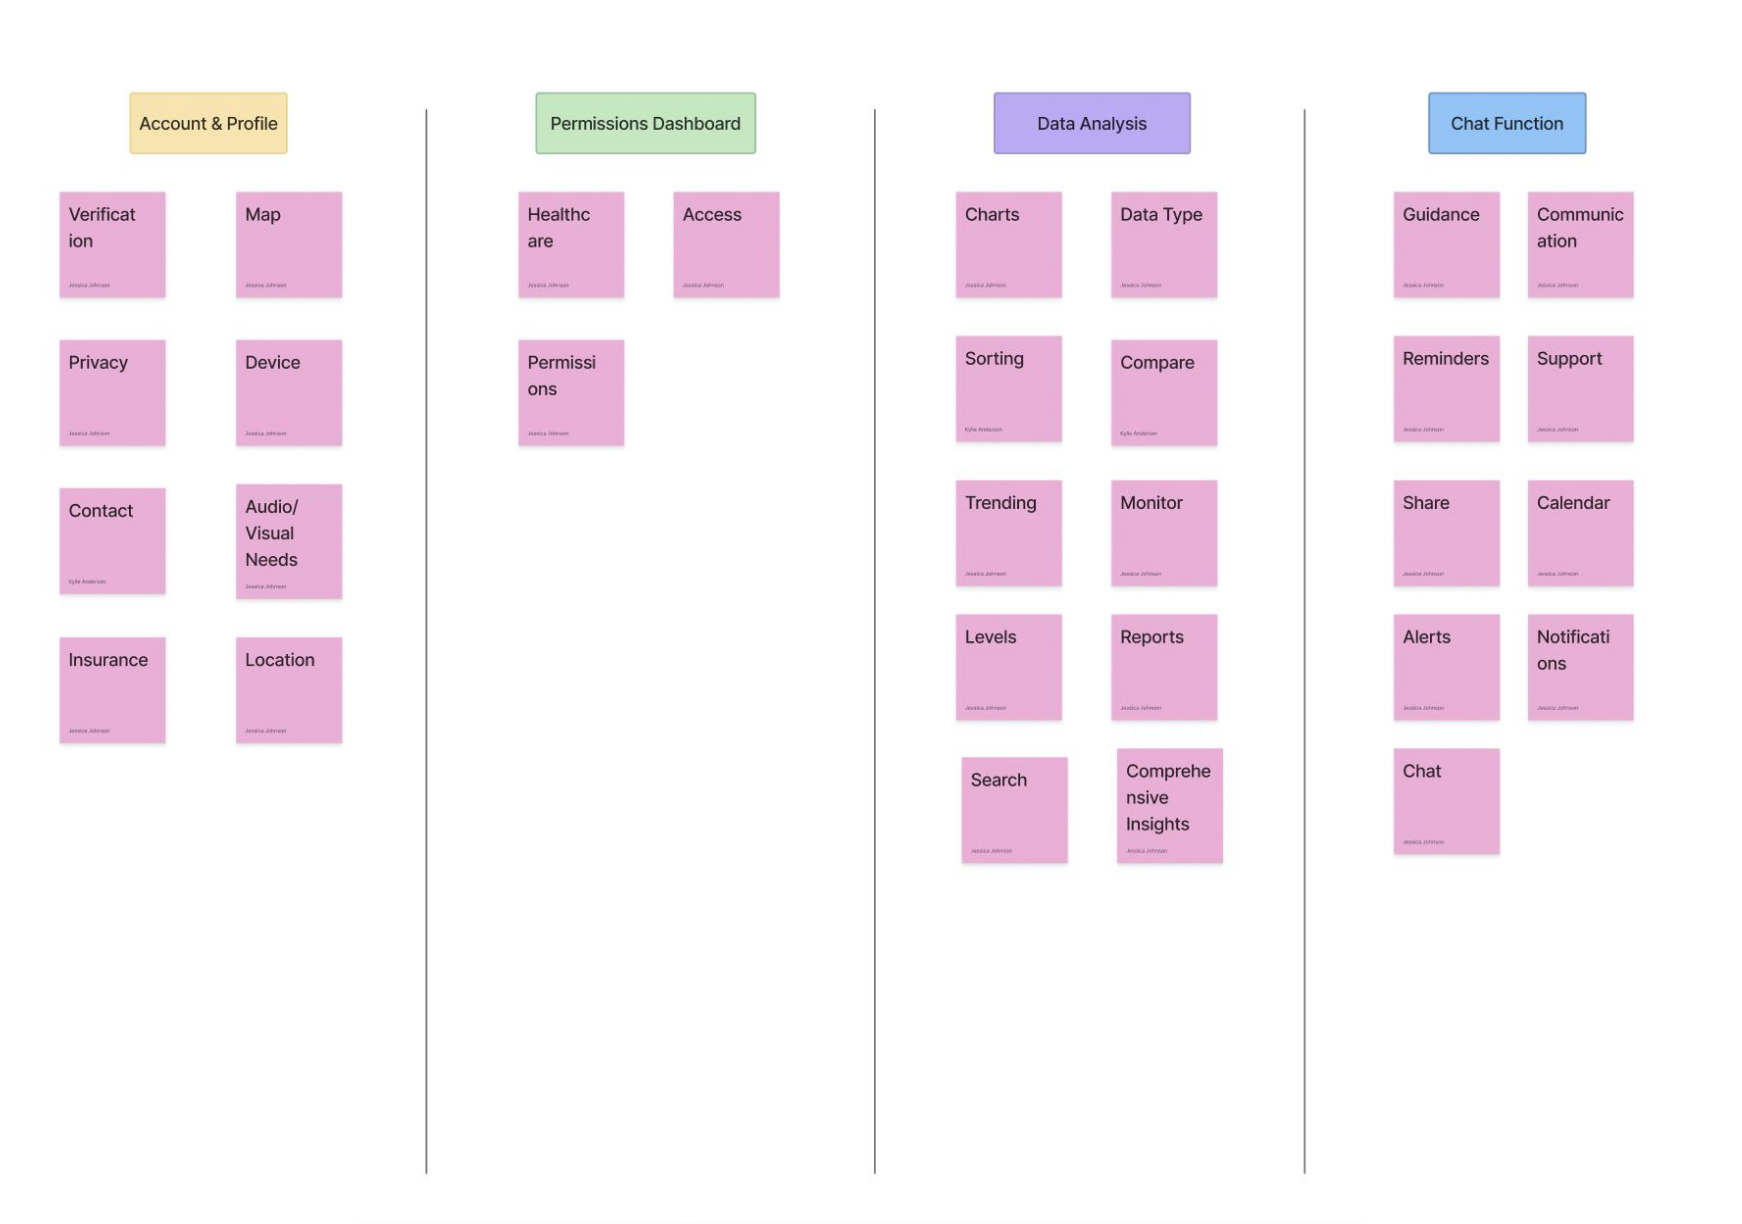
The Design process began with Card Sorting. The three users below interpreted the topics in mostly similar ways; they have conflicting mental models for certain topics but aligned for the most part.
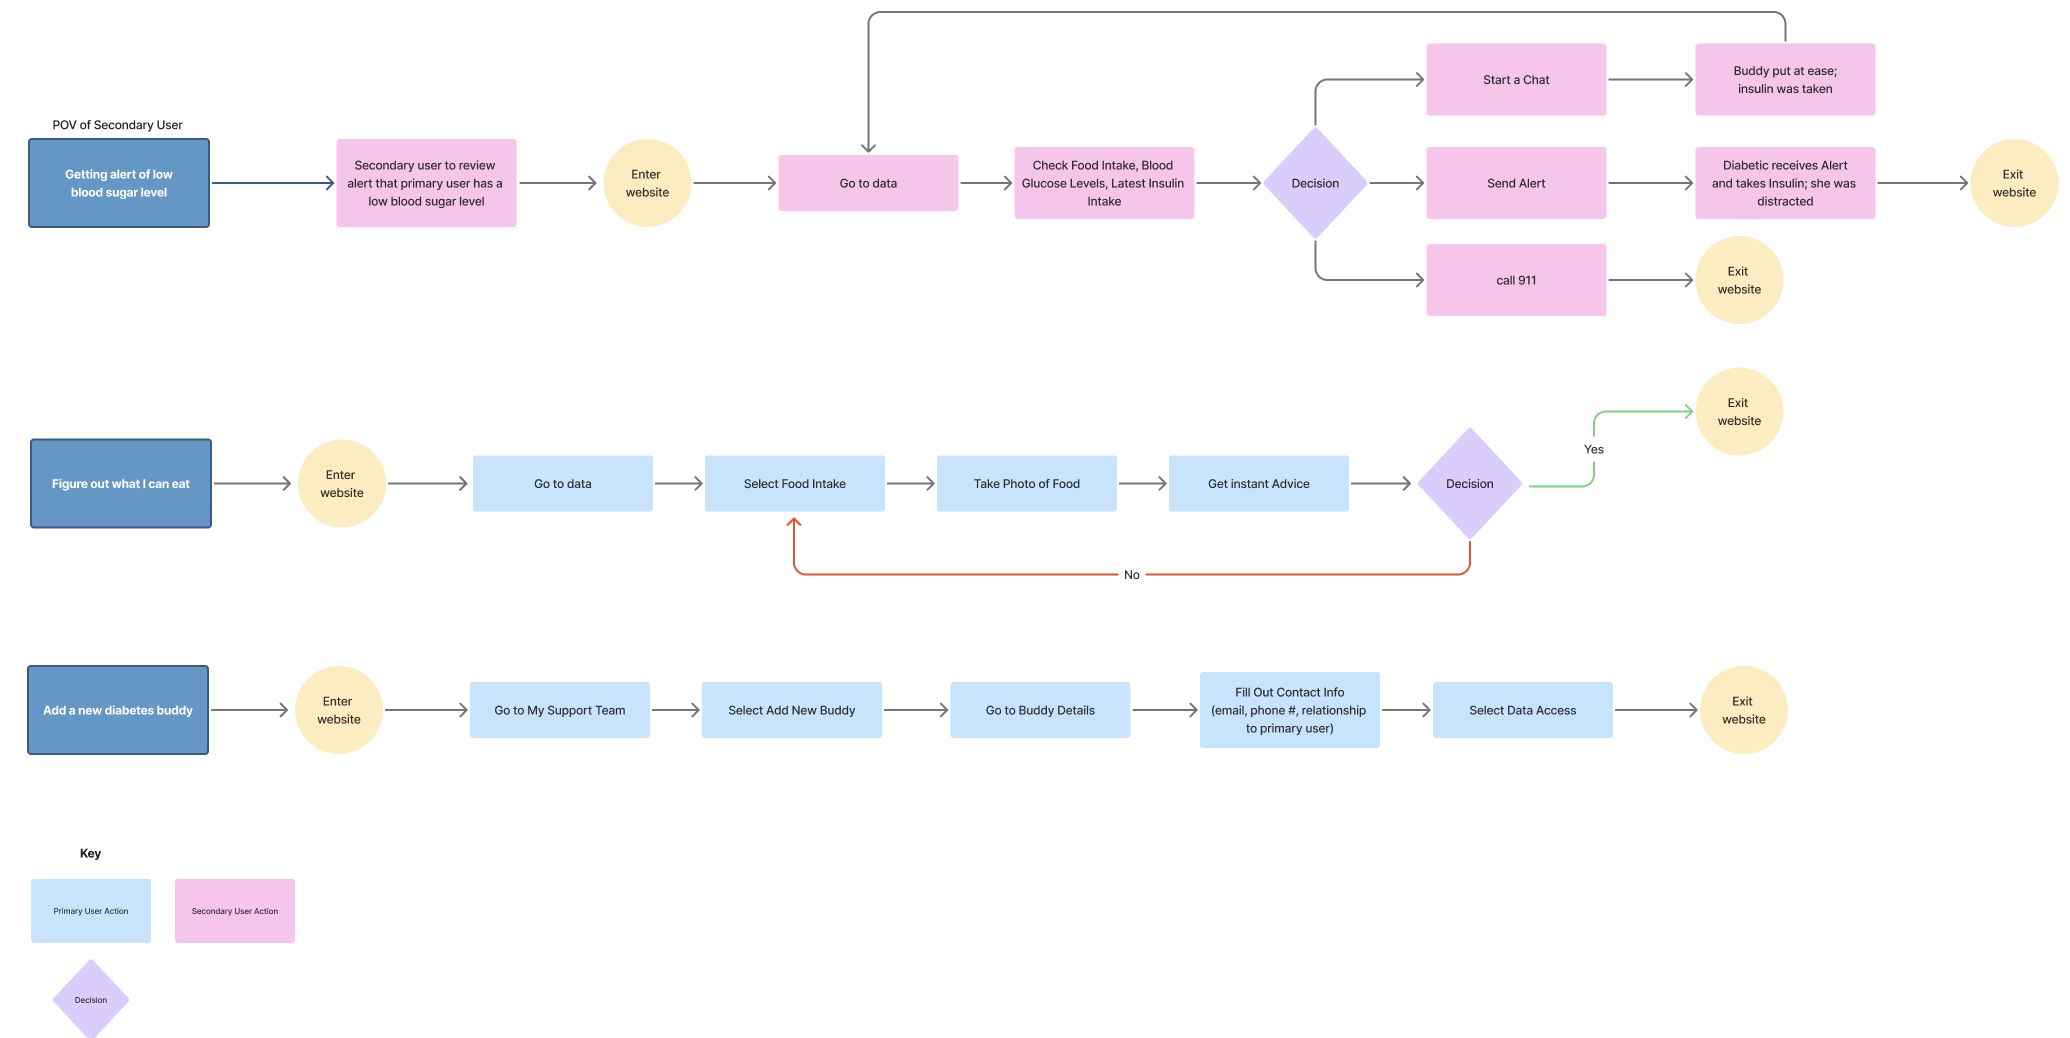
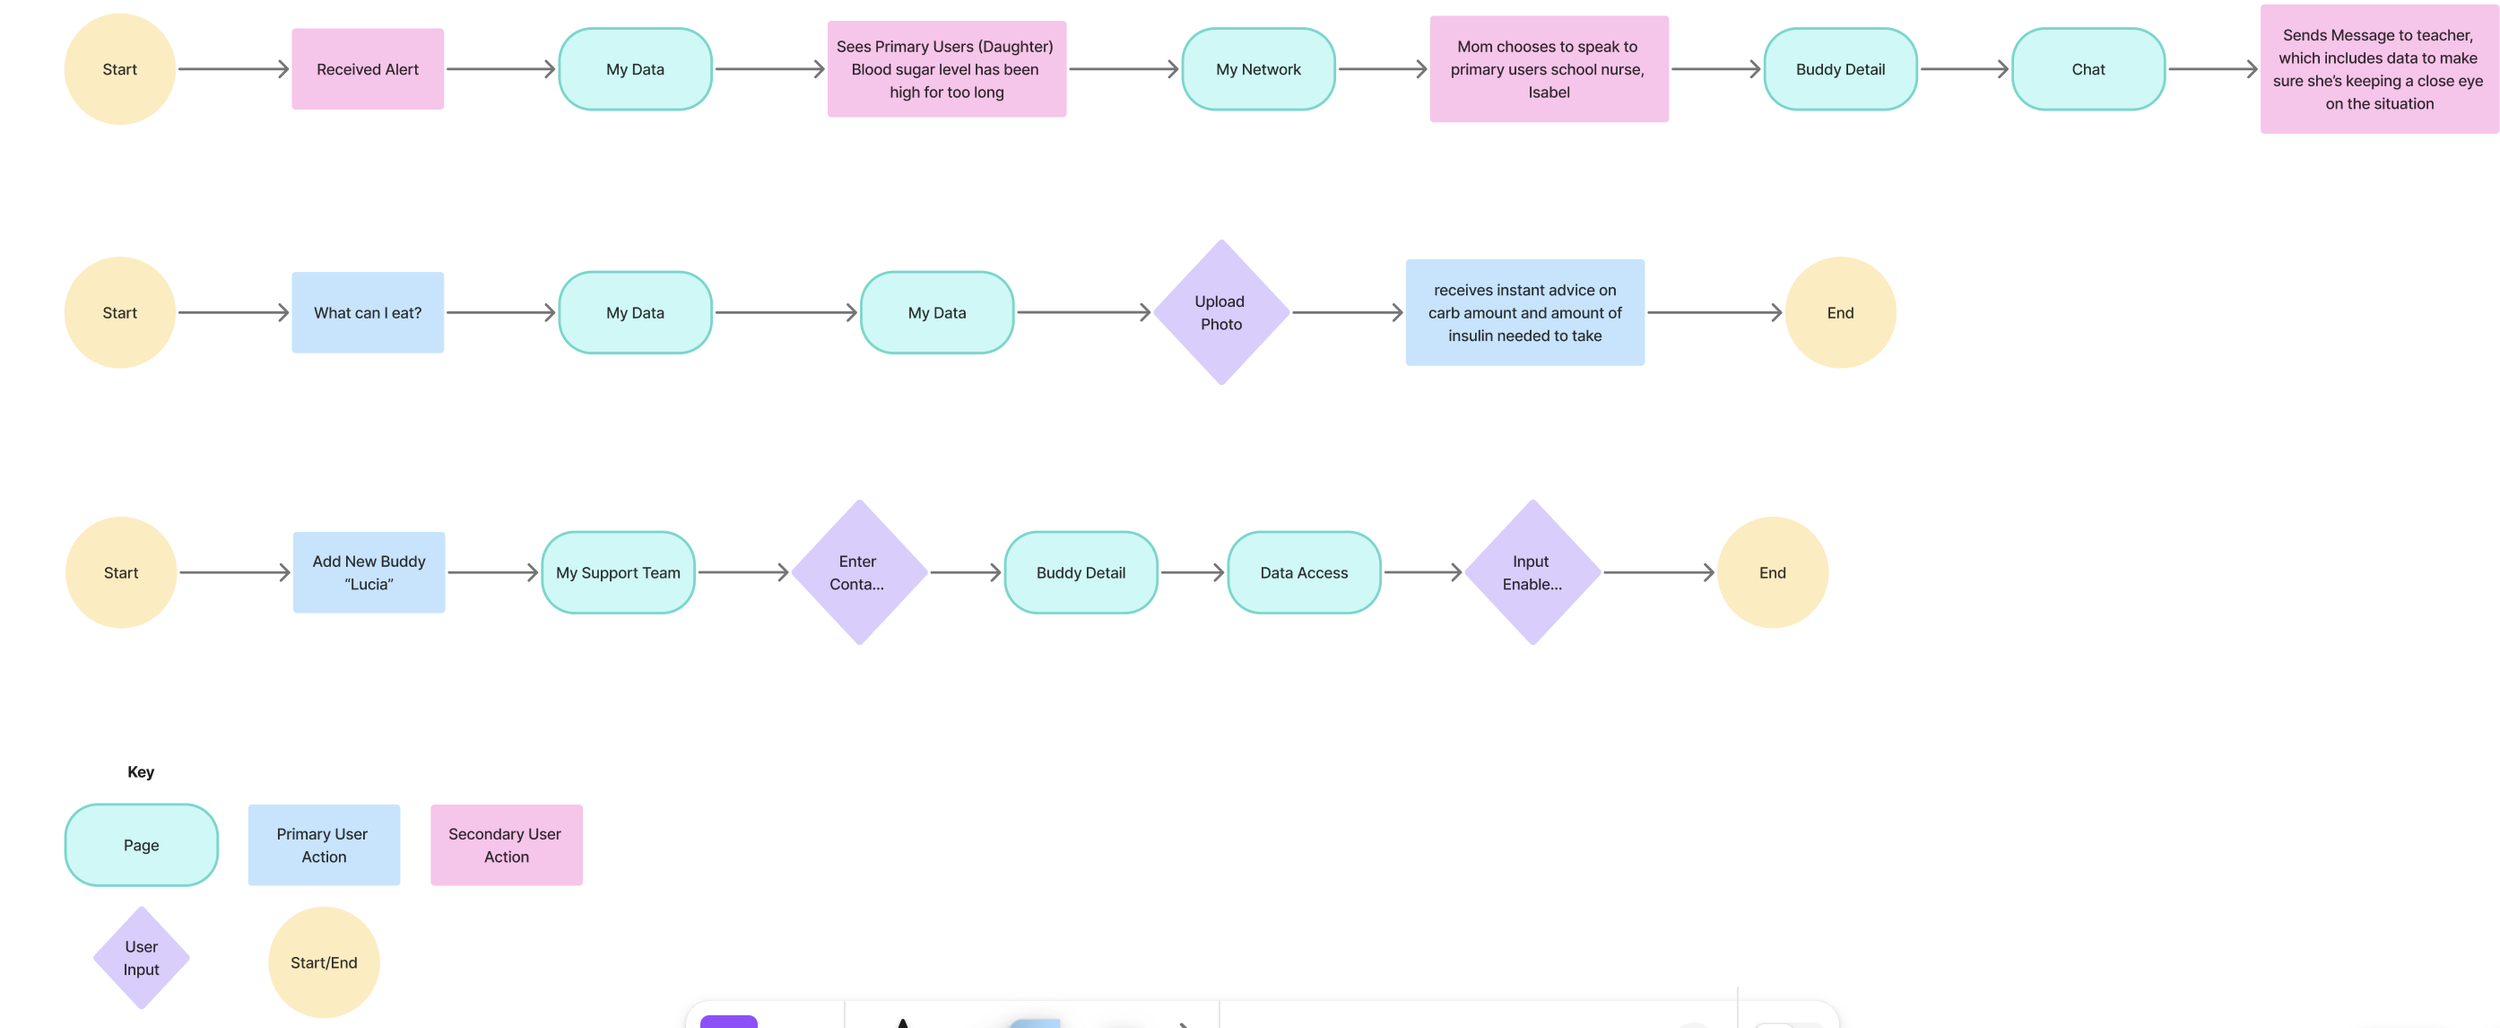
User & Task Flows were used to
Clarify user goals
Map the step-by-step journey
Identify friction and errors early
Improve usability and efficiency
Align teams around behavior, not screens
Support better design decisions
Help prioritize features
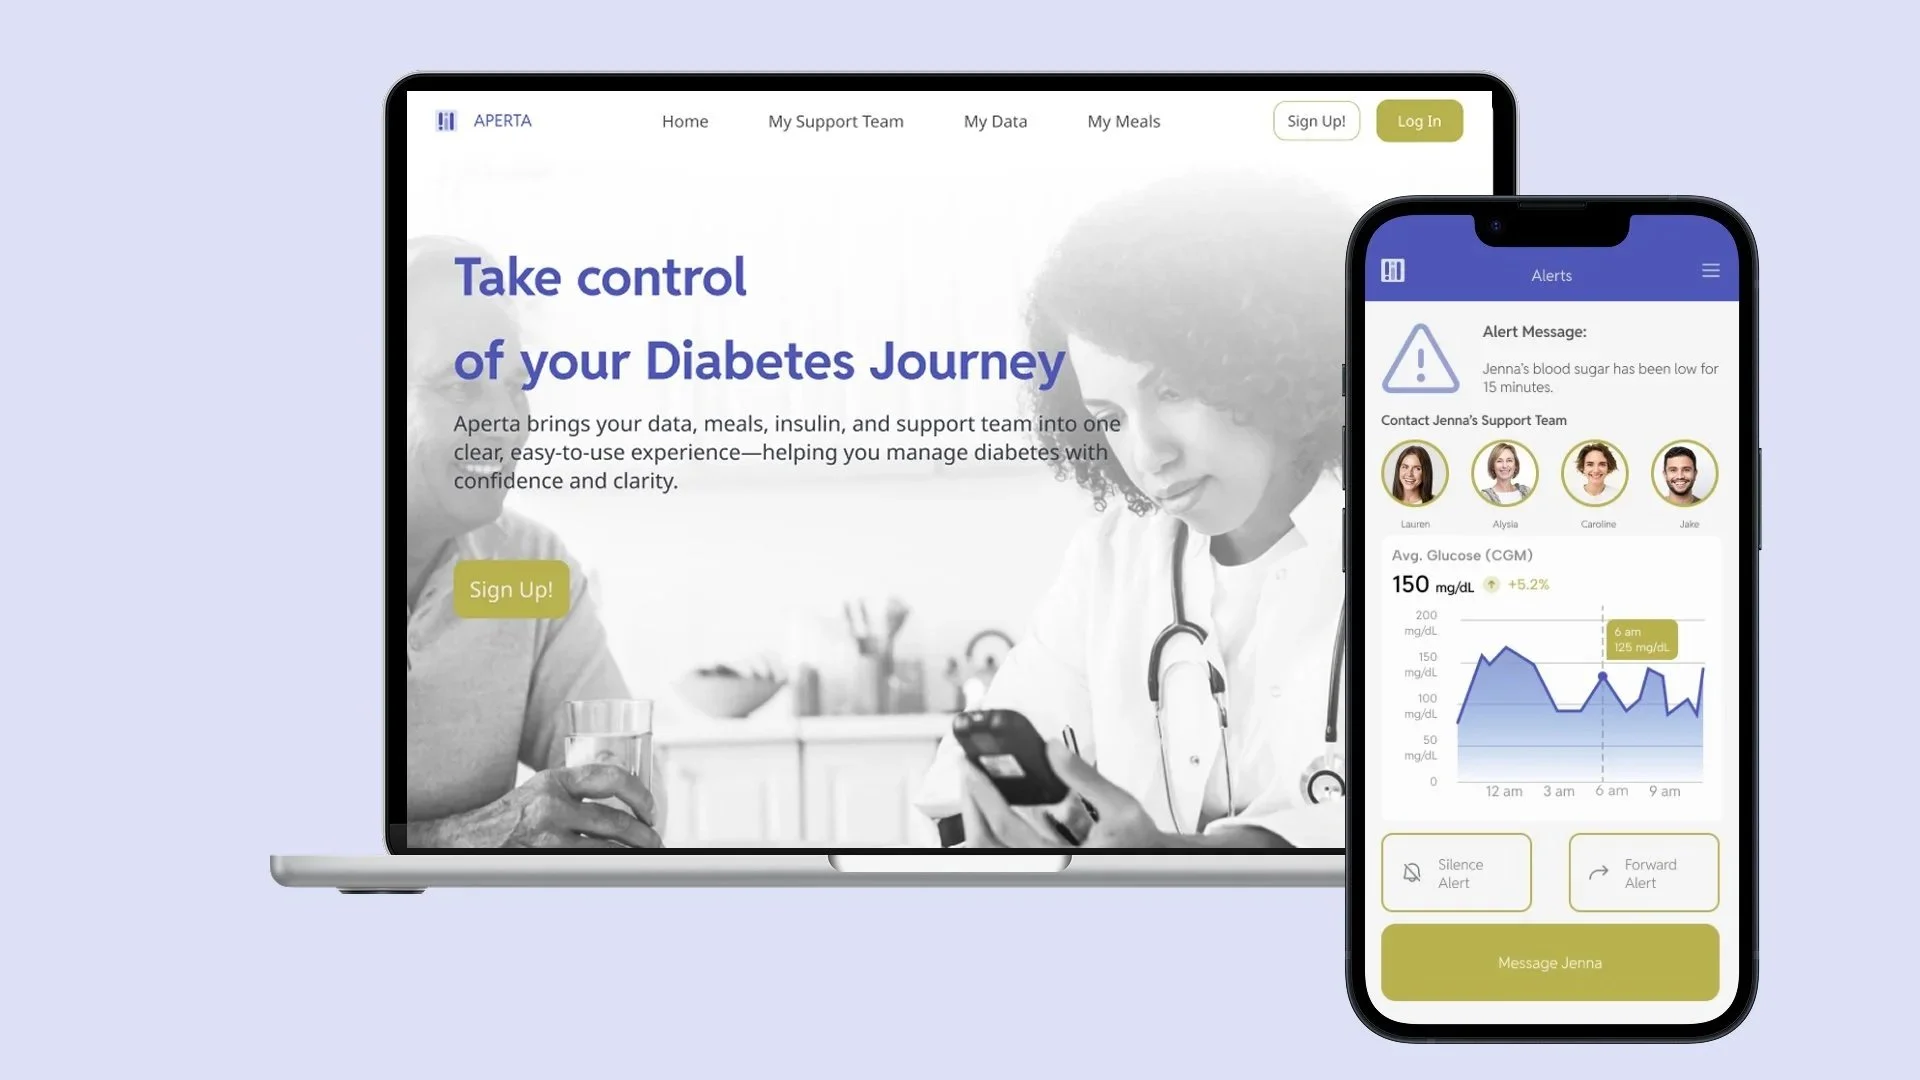
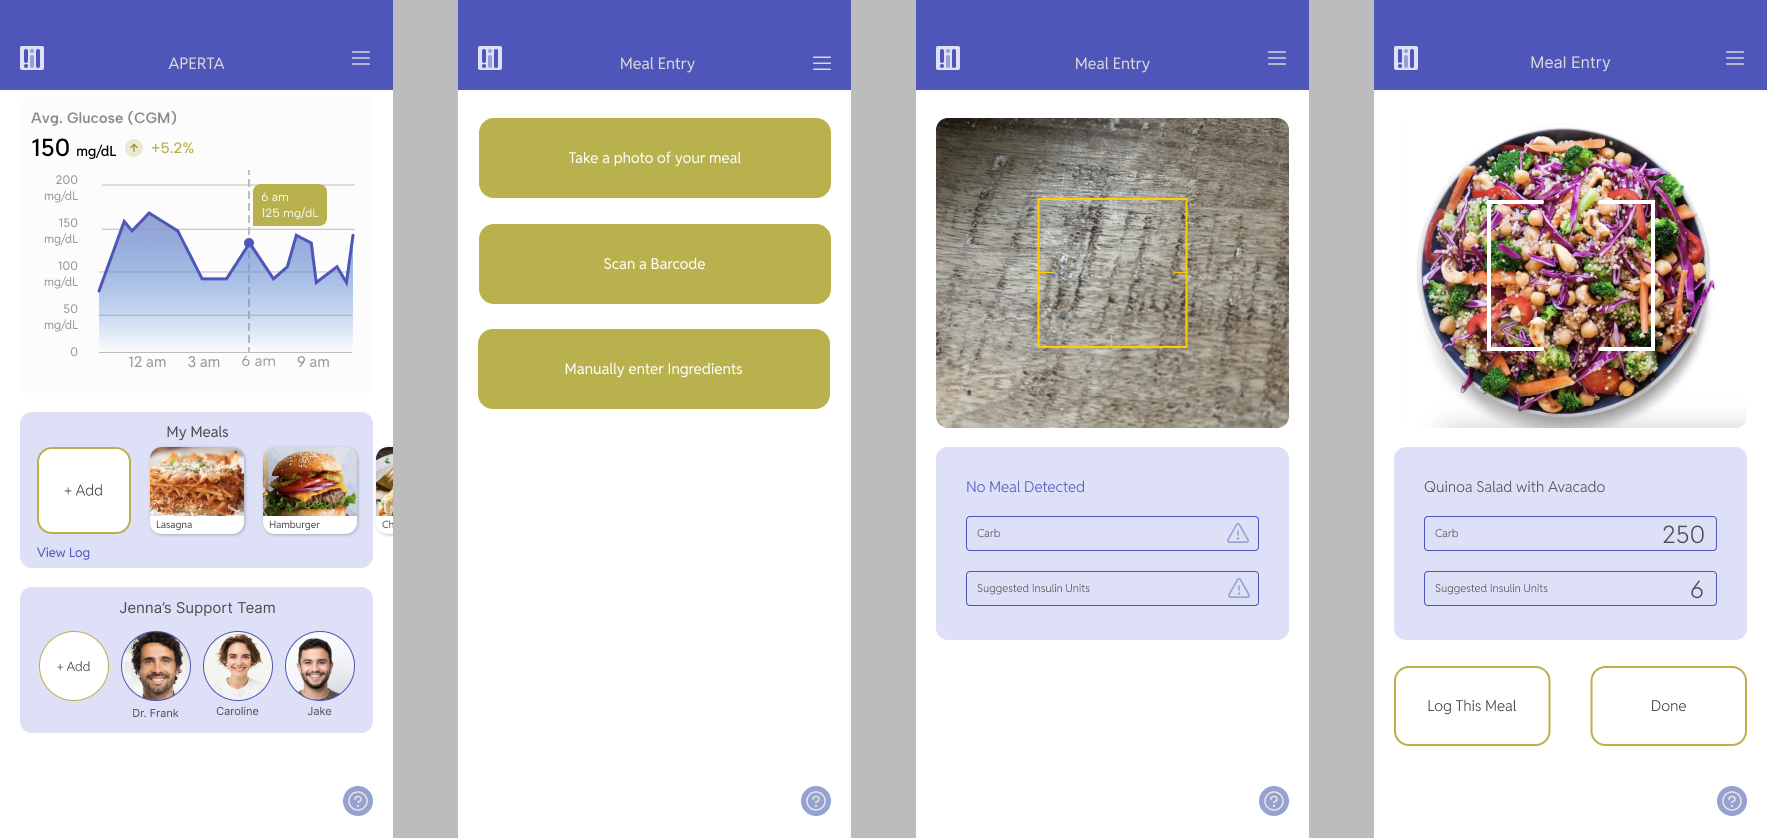
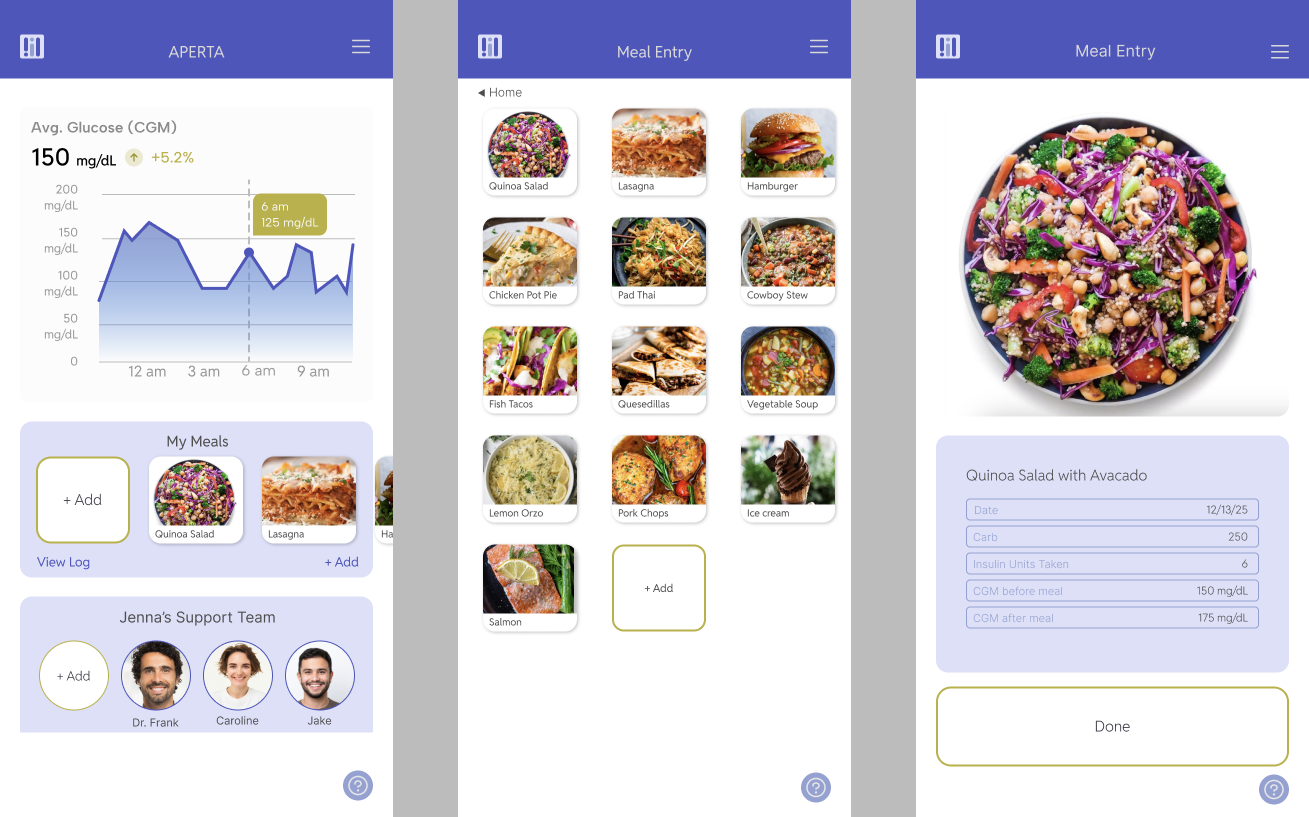
I started with the initial design of the home page. The homepage focuses on Alerts, Meal Entry, Easy access to Stats and a panel for communication with a team chosen by the diabetic.
Meal Entry Task Flow beginning to take shape. I looked at what worked and did'n’t work in my competitors meal entry and implemented what worked well.
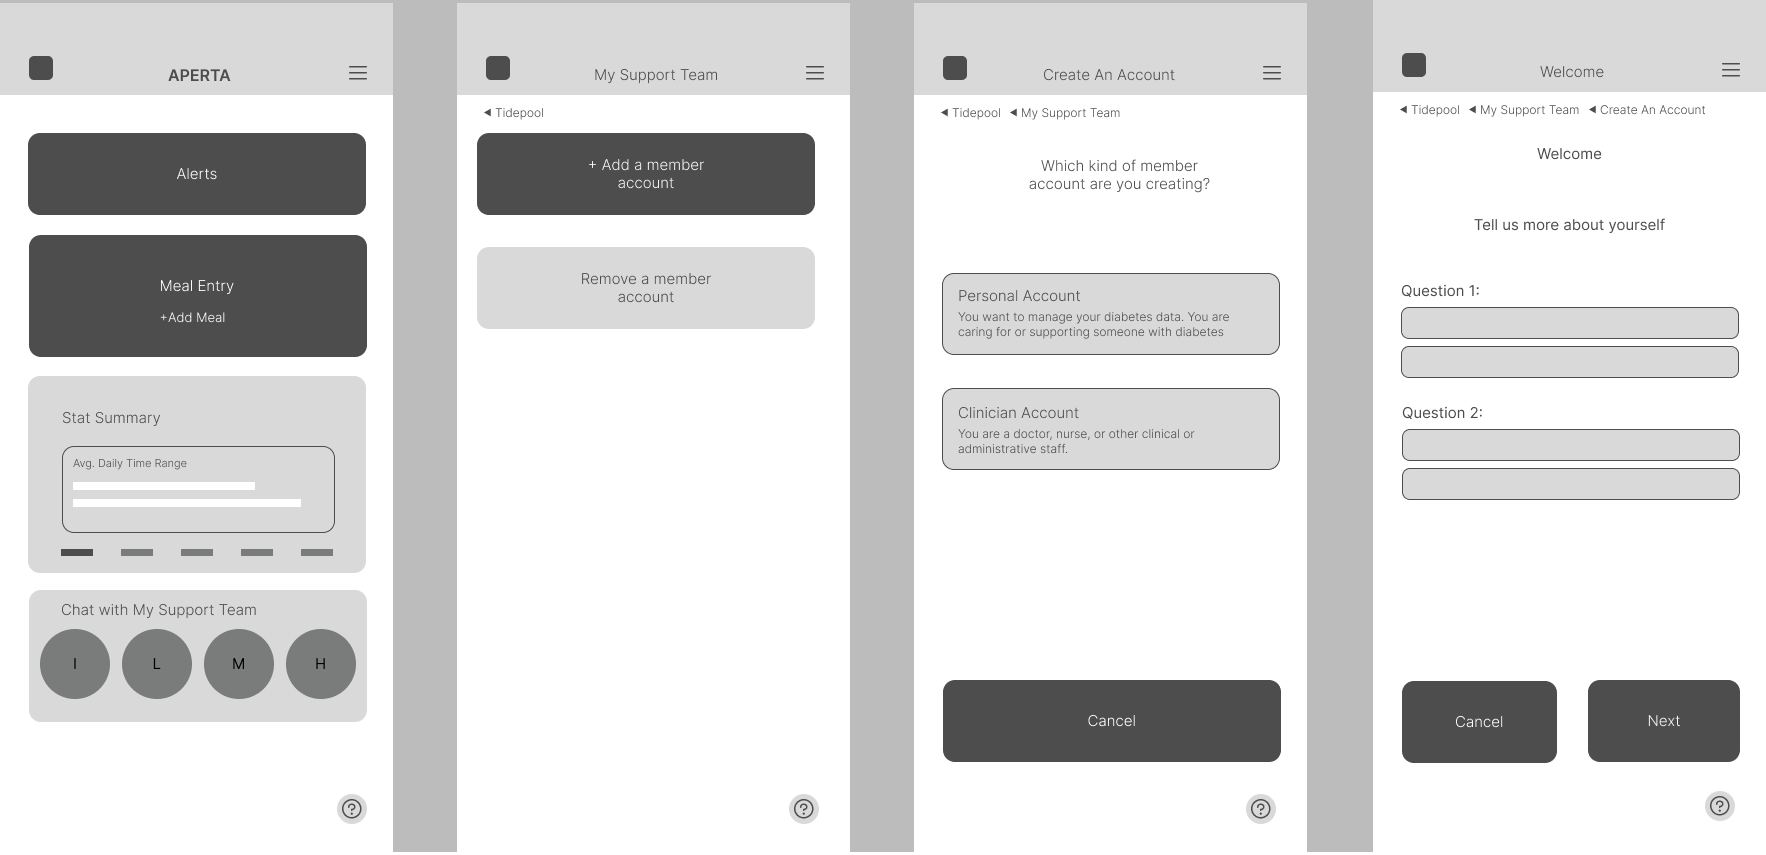
I started thinking about how we could more easily guide users to add a team member or clinician
Low-Fidelity and Mid-Fidelity Wireframes
The alert page focuses on the alert message, easy to read Stats, simple and direct choices on how to respond to the alert
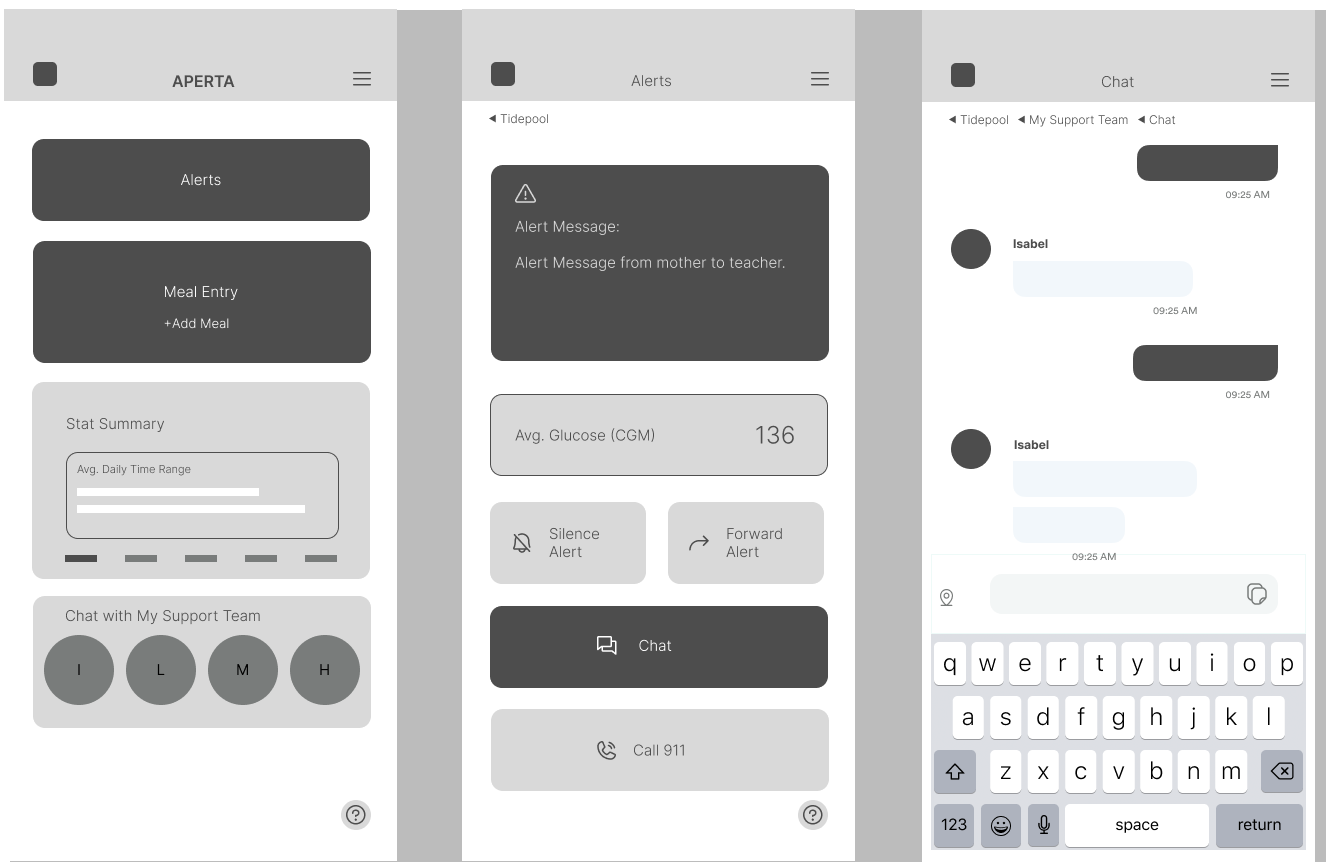
The simple easy to read chat messaging structure beginning to form
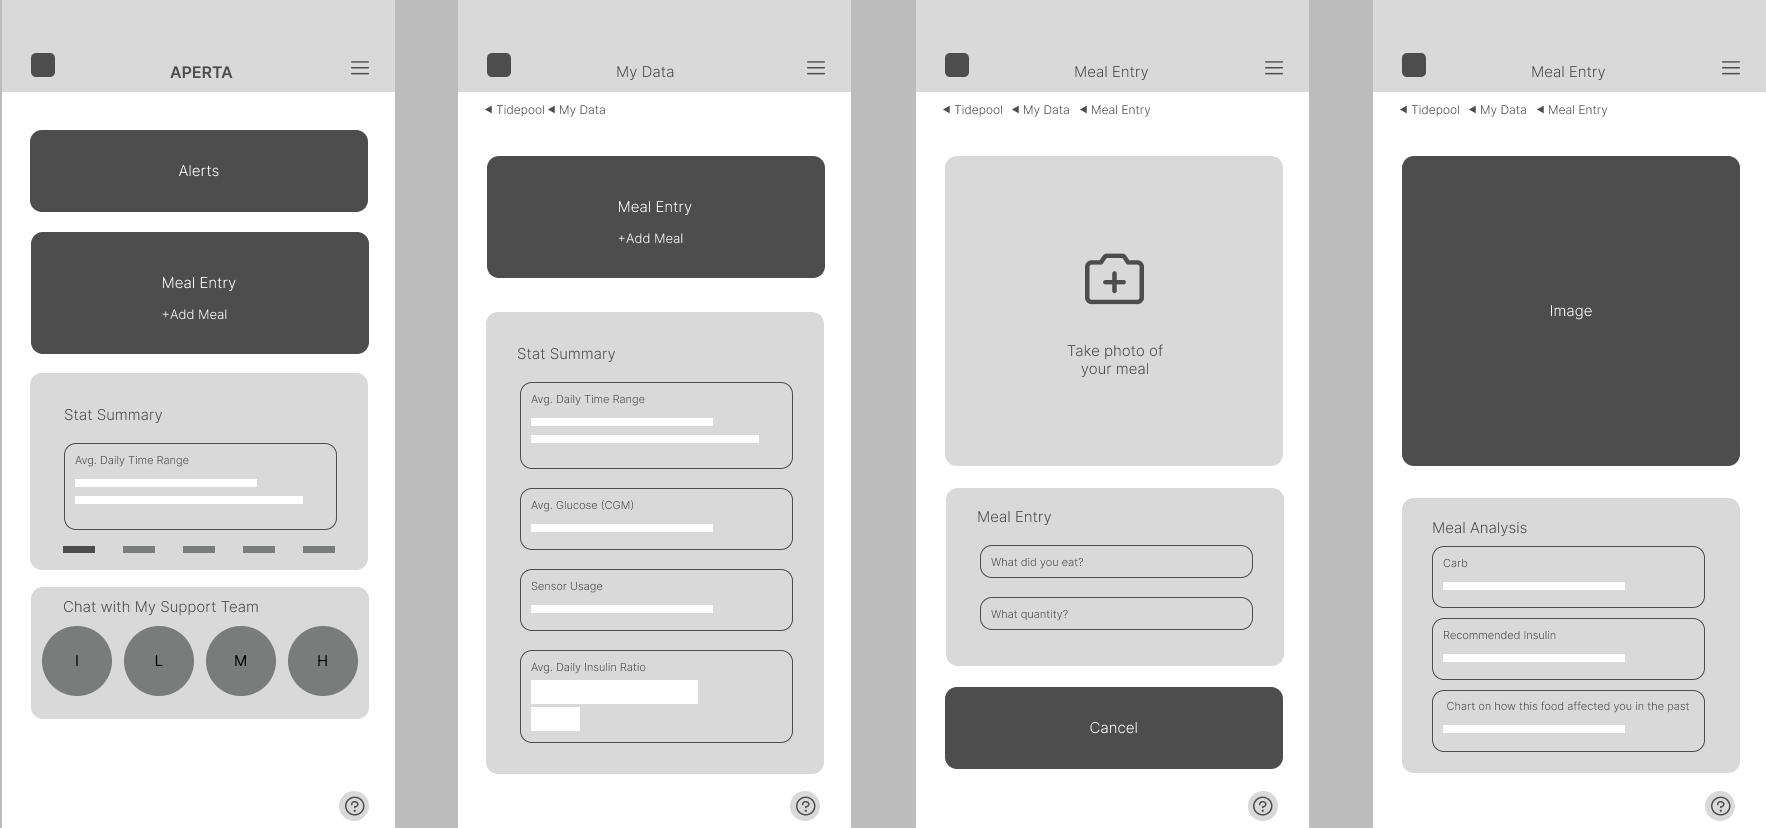
Using image detection technology carb count would be derived, suggested insulin intake would be displayed and history of how this food affected you in the past.
Brand Development & Visual Designs
Logo Design
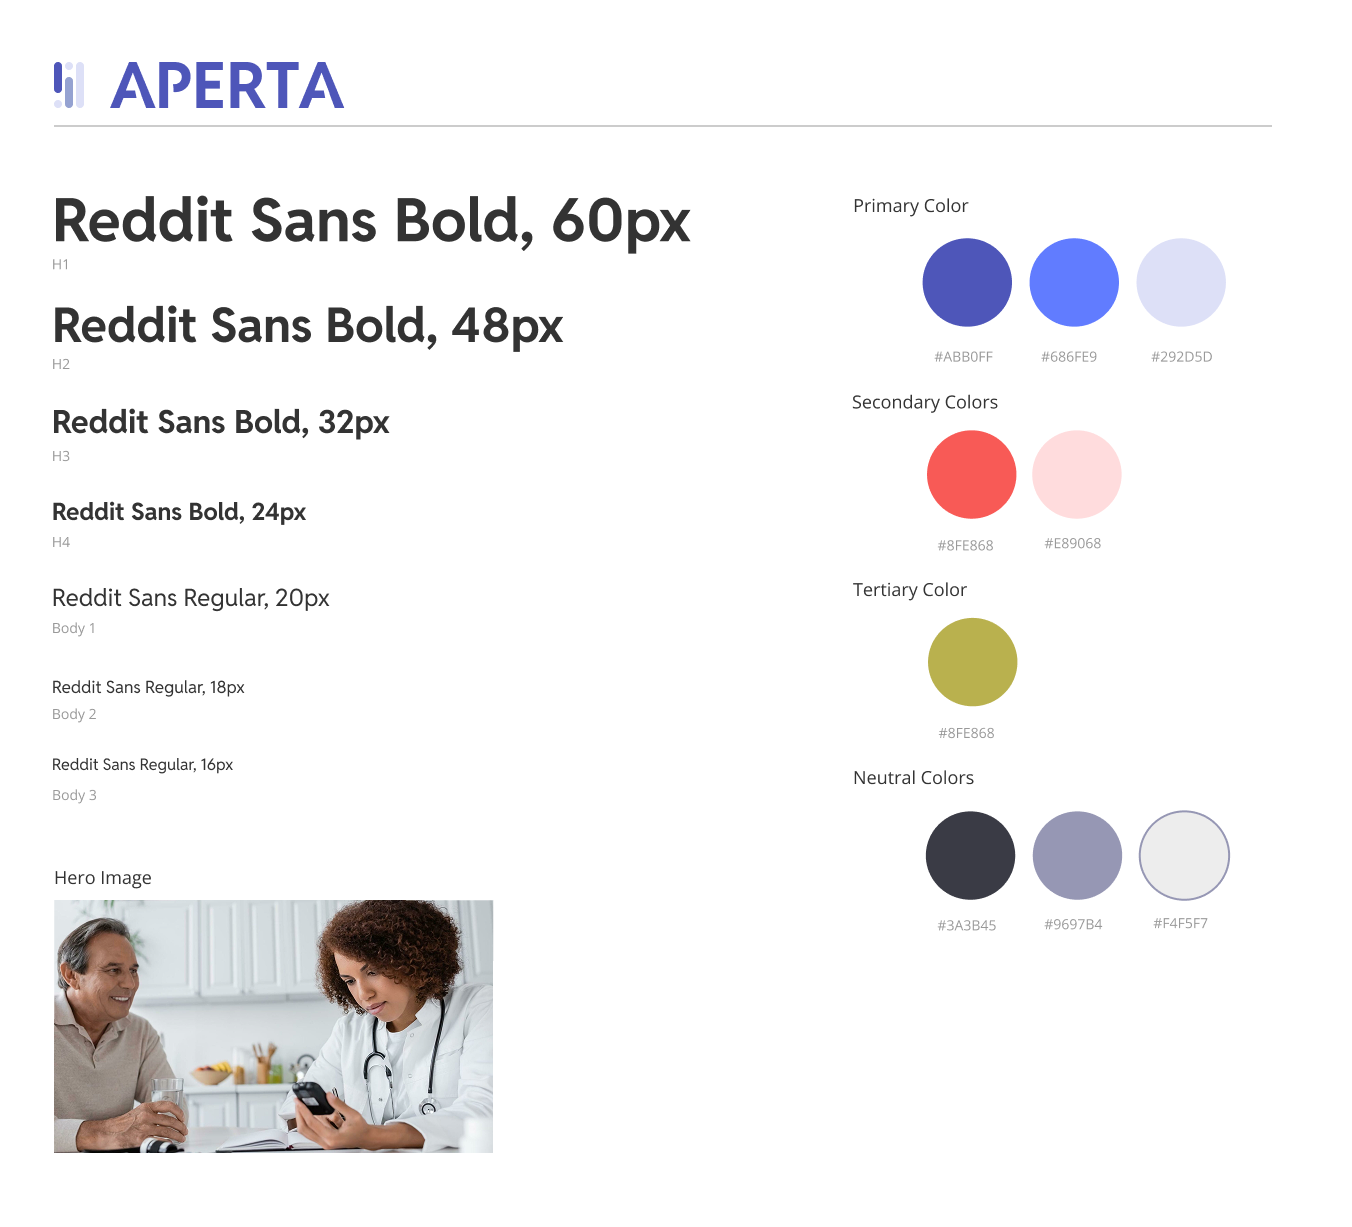
Style Tiles
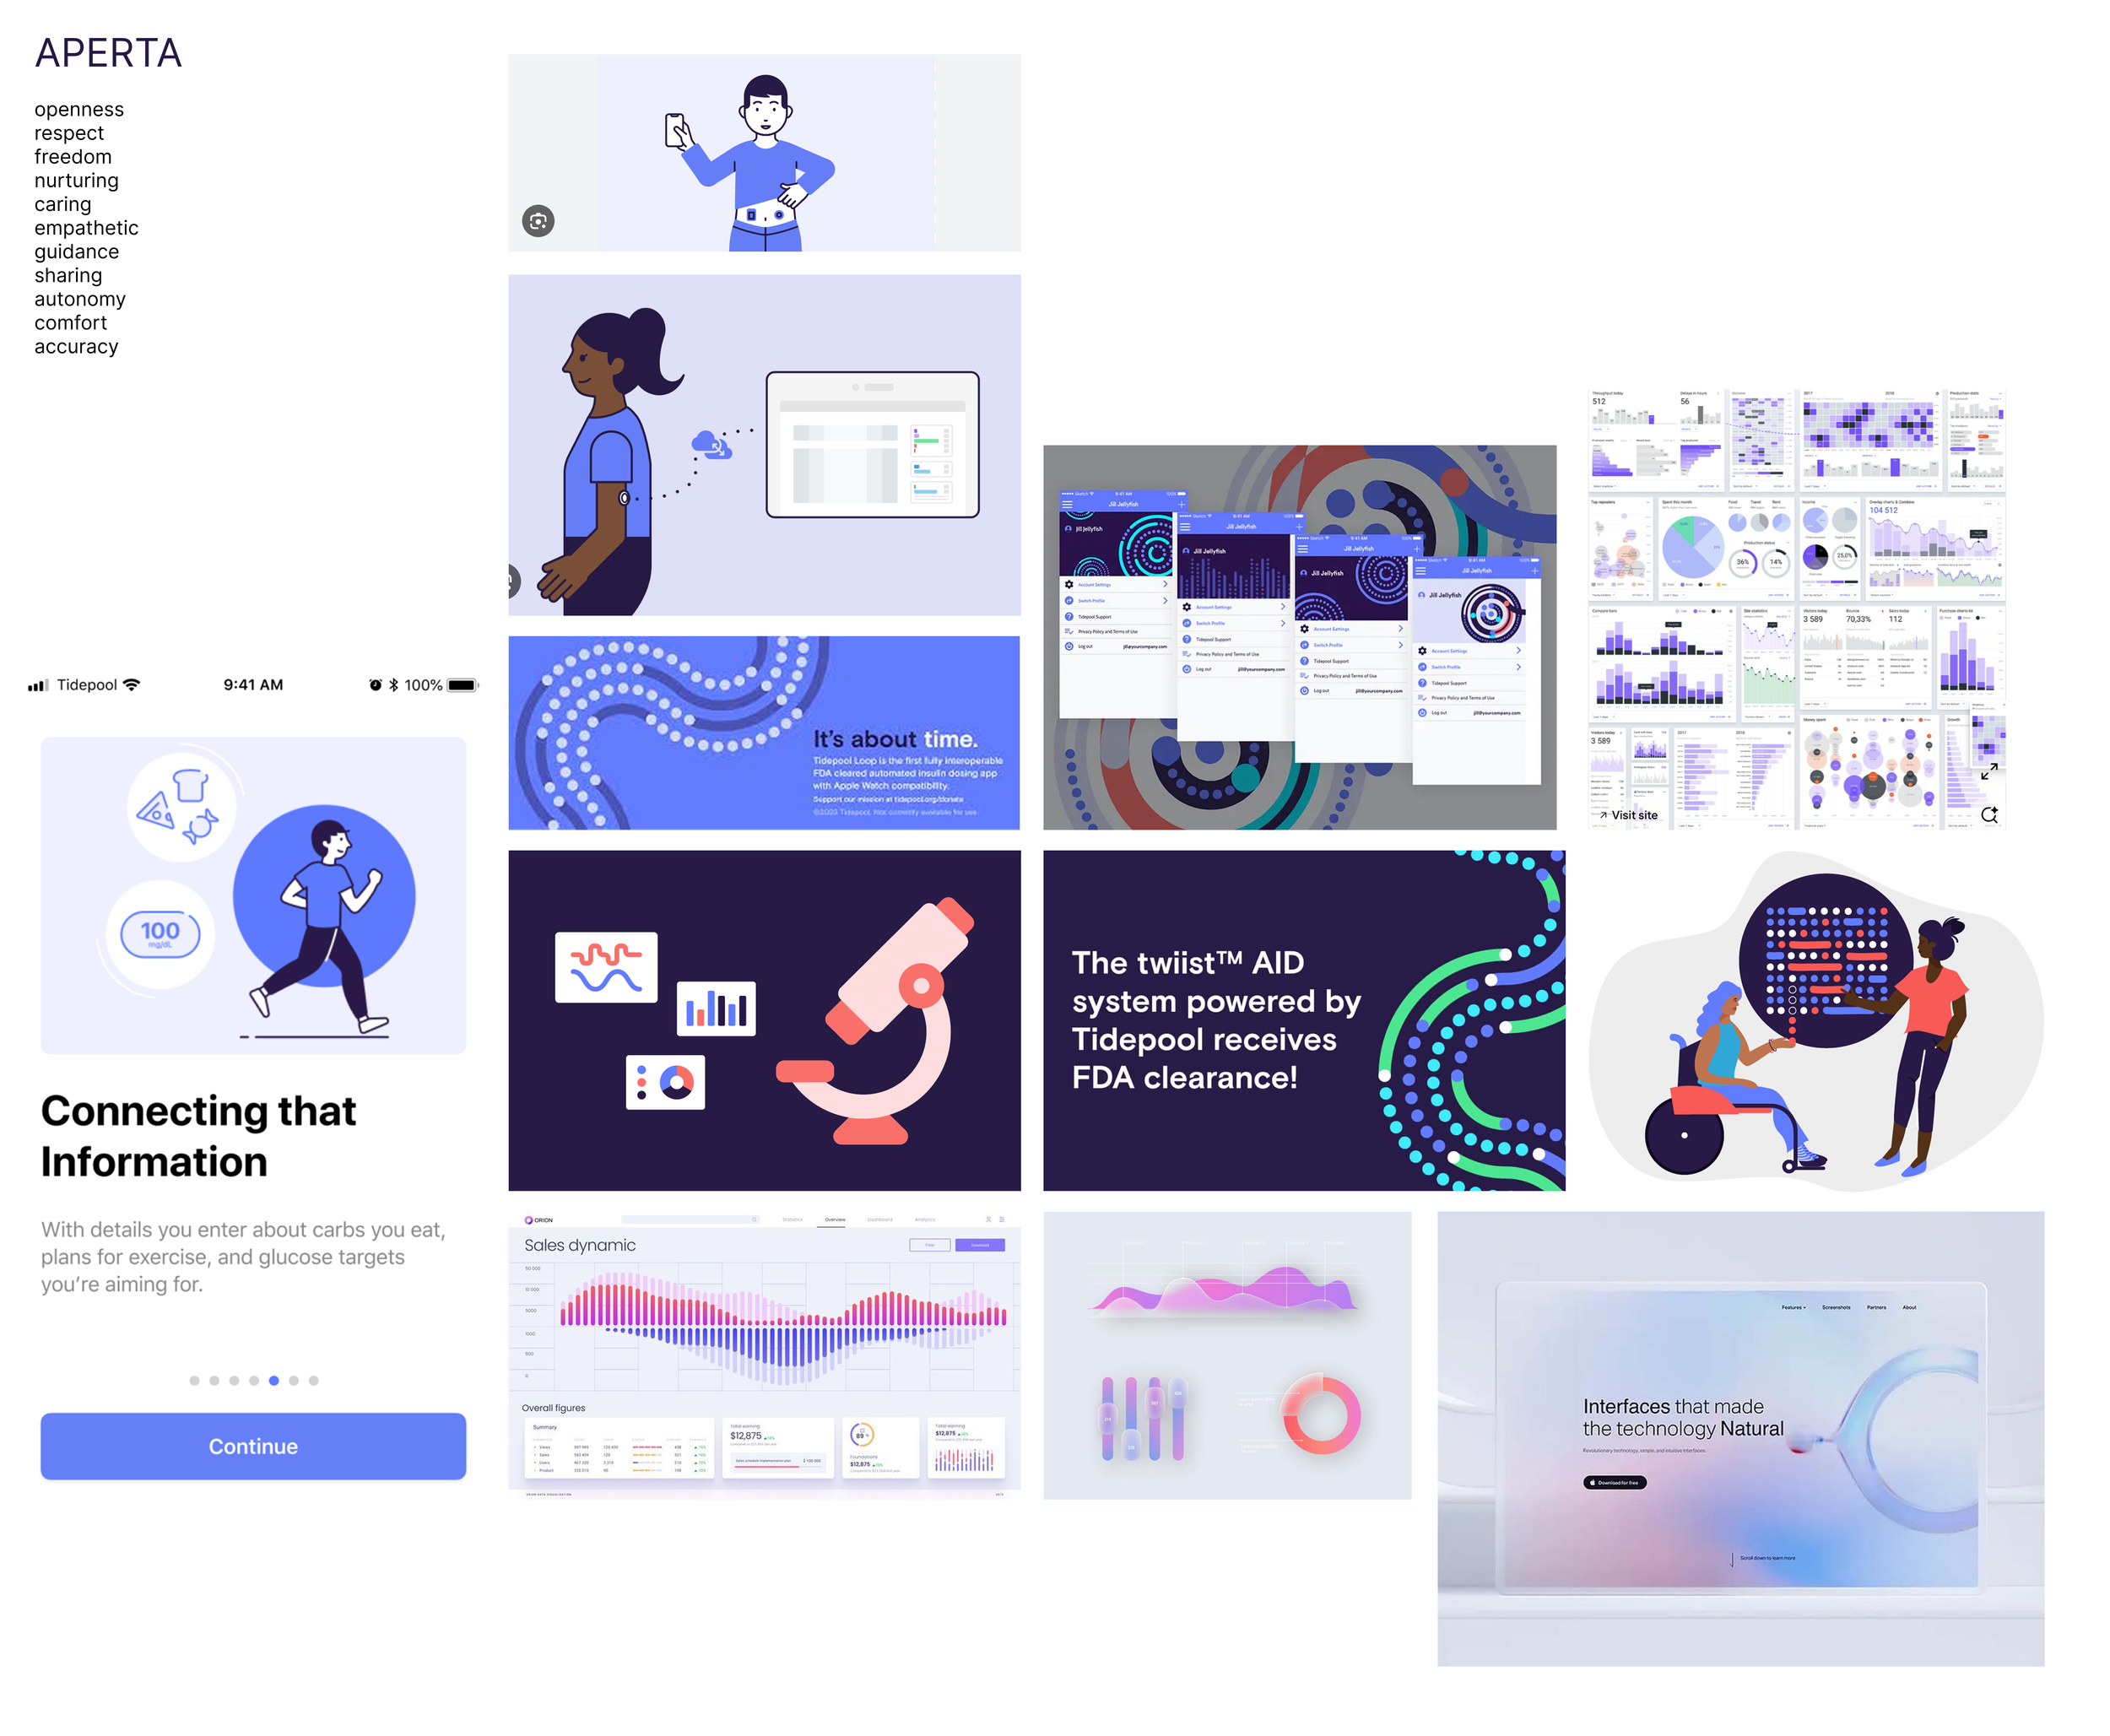
Mood Board
High-Fidelity Wireframes
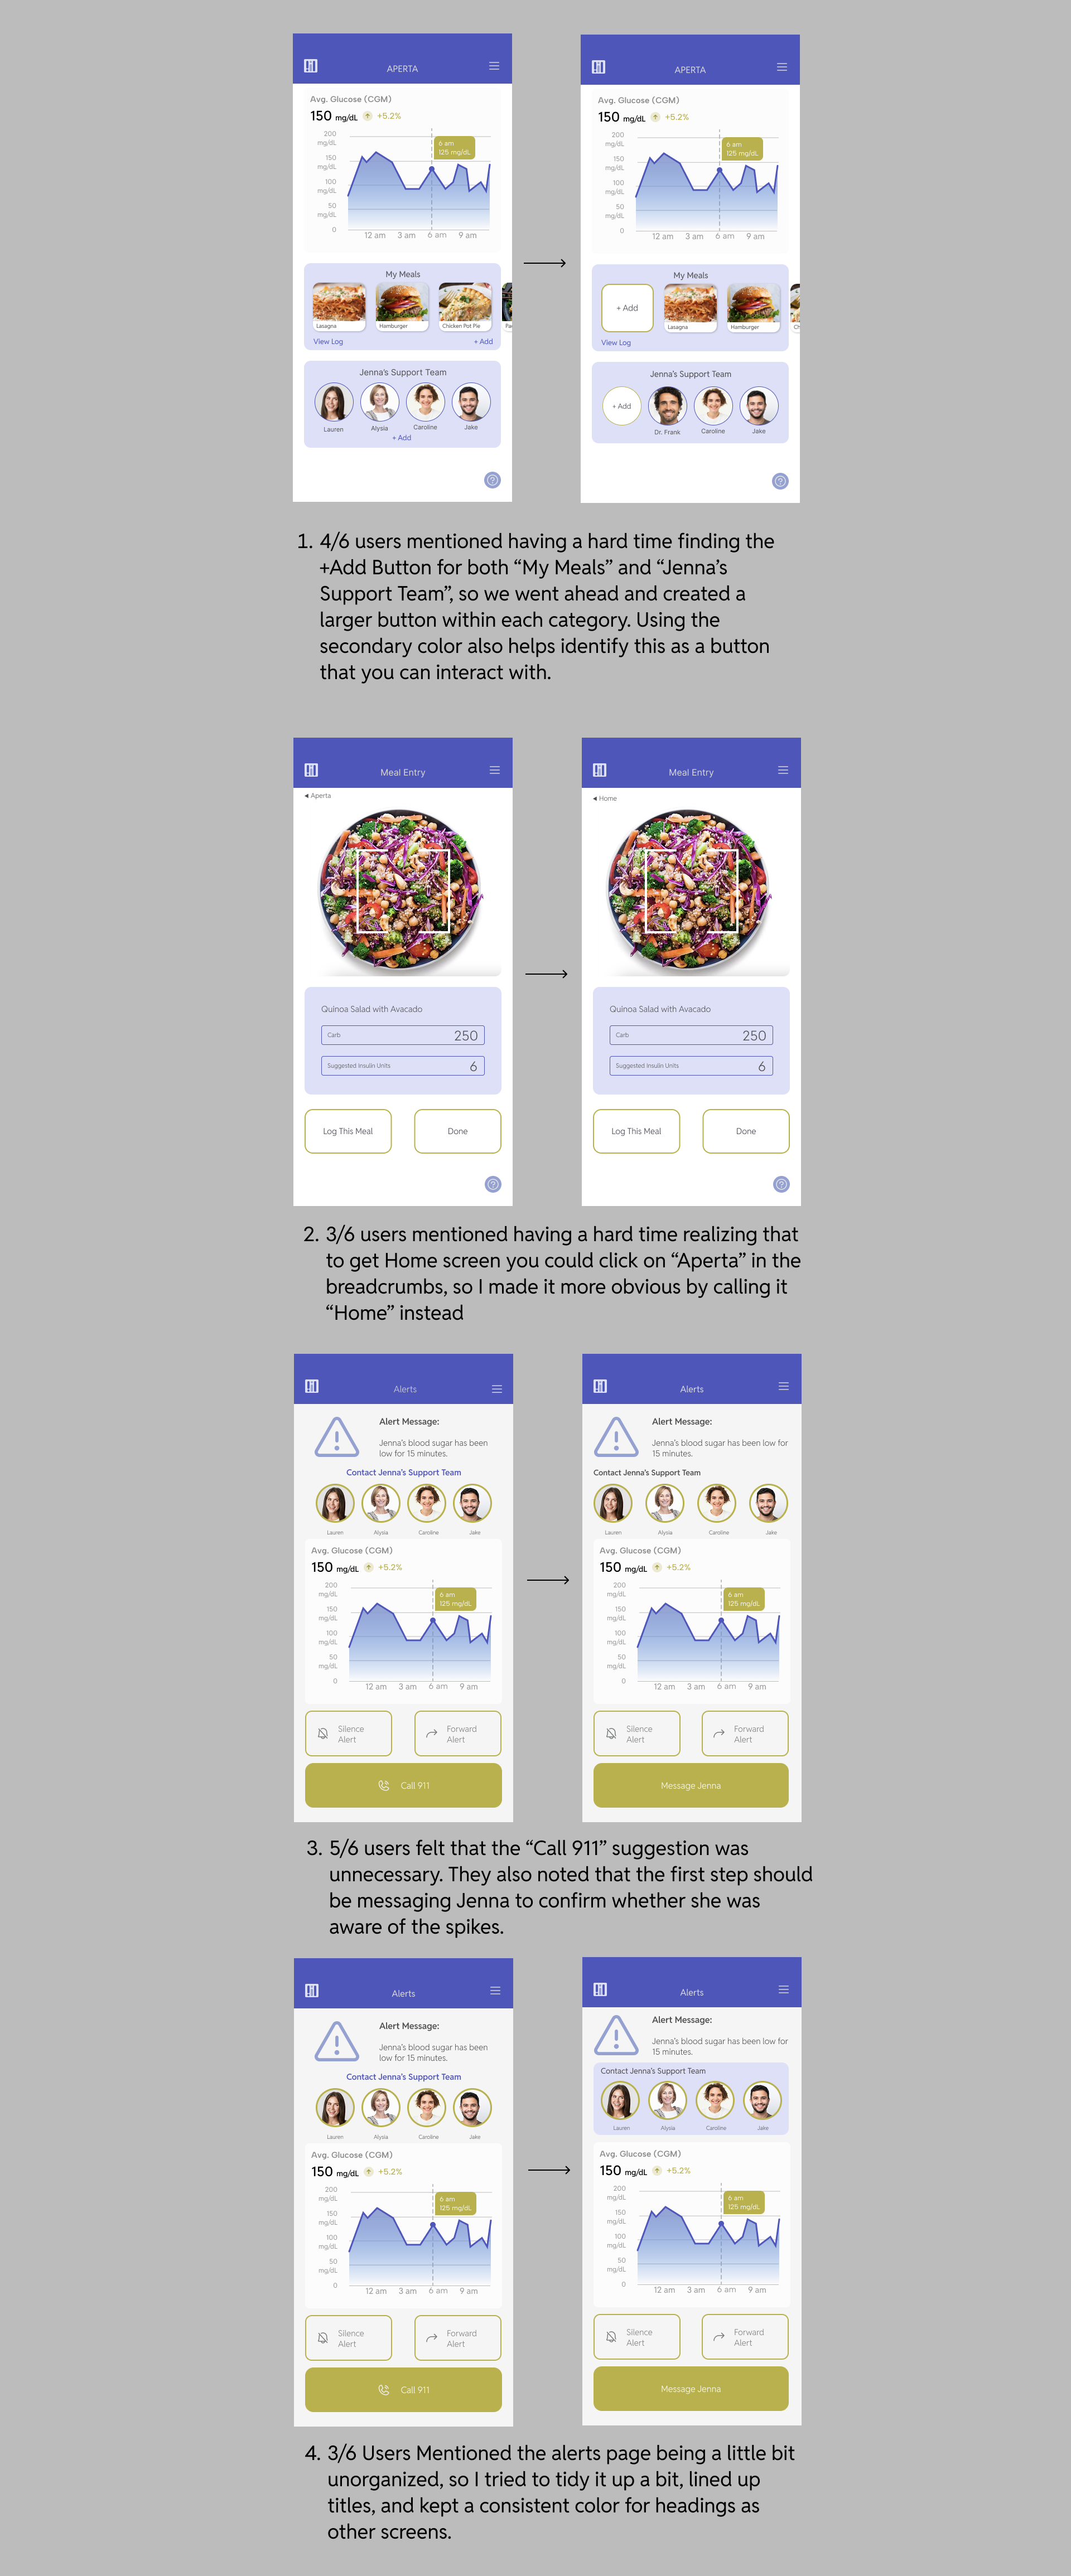
The product was then tested and with the feedback given by 6 users iterations were made.